Why Your Win Rate Drops in Live Trading: 7 Execution Leaks Backtests Miss
A strong backtest creates a tempting assumption: if the setup worked on historical data, it should work live. Then the first 20 or 30 real trades come in, and the win rate is worse than expected.
At that point, many traders make the wrong diagnosis. They assume the strategy is broken before checking whether execution is the real problem.
That mistake is expensive. It costs money, but it also damages confidence. Once confidence slips, hesitation, chasing, and overtrading often follow, which makes the original problem worse.
The good news is that a lower live win rate does not automatically mean the edge was fake. Often, the strategy logic is still sound, but the execution layer is dragging down results. This guide will help you find the leak, separate execution problems from strategy problems, and fix the right thing first.
Key Insight: A backtest can validate an idea. Only live trading shows whether that idea is actually tradeable under real conditions.
Why win rate often drops when you go live
The gap between theoretical edge and executable edge
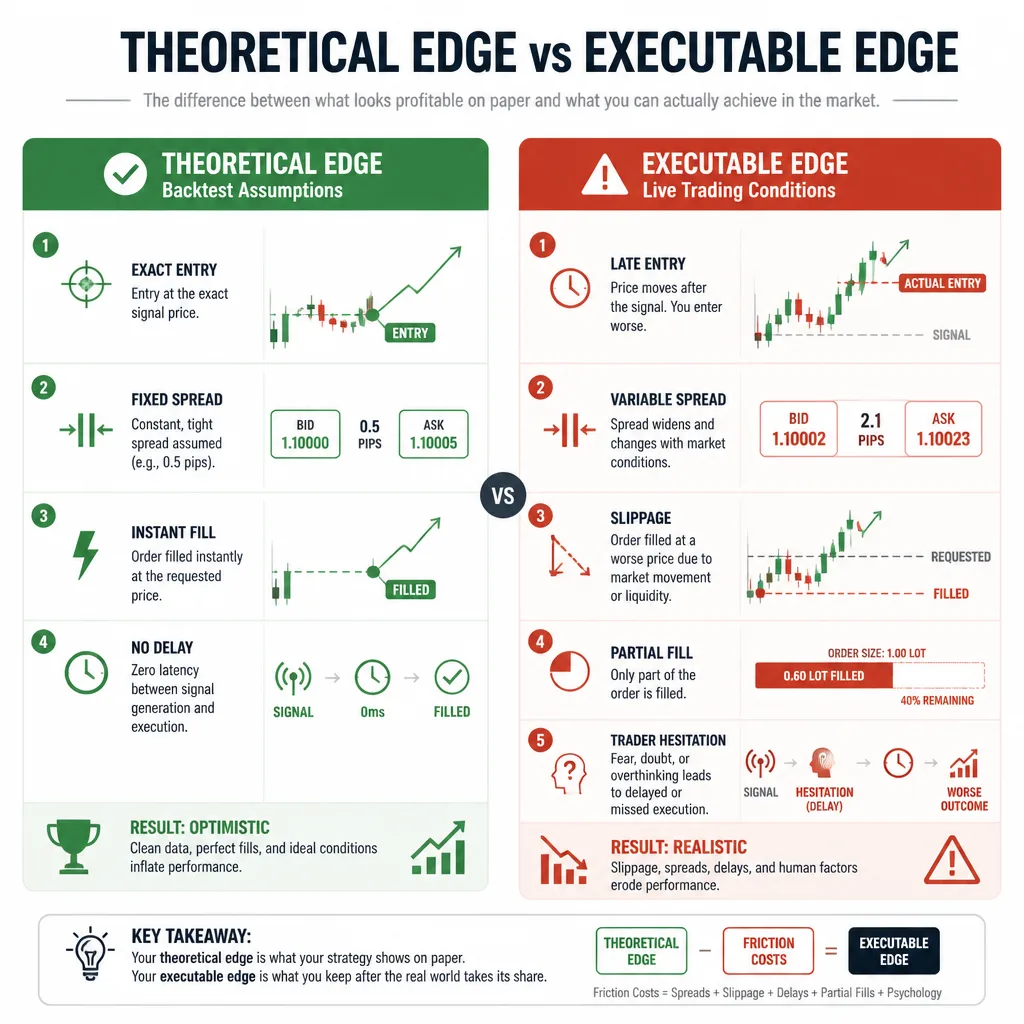
Backtests usually measure theoretical edge. Live trading tests executable edge.
That difference matters more than most traders realize.
A setup can look profitable when entries are assumed to happen exactly at the trigger, spreads stay stable, and fills are instant. Live trading adds real order handling, real latency, changing spreads, and human timing errors. Any one of those can weaken an otherwise solid system.
This is especially important for short-term traders. A swing trade targeting 150 pips can absorb a slightly worse fill. A scalp targeting 5 pips often cannot.
Why backtests miss the frictions that matter
Many backtests simplify or ignore:
- Variable spreads
- Slippage
- Partial fills
- Delayed execution
- Session-specific liquidity
- News-driven volatility
- Behavioral errors under pressure
A fixed-spread backtest on EUR/USD might show a clean edge at 0.8 pips. But if the live spread widens to 2.0 or 3.0 pips during entry, the trade math changes immediately.
The key question to answer first
Before changing the strategy, ask one question:
Is the setup failing, or is execution degrading it?
If chart review still supports the setup but your fills, timing, or discipline are worse than the test assumptions, the strategy may not be the main issue.
Decision Rule: Do not change the strategy until you have reviewed a meaningful sample of live trades for execution quality and rule adherence.
Bottom Line: Backtested edge and executable edge are not the same. Your job is to identify which one broke first.
The 7 execution leaks that quietly reduce win rate
| Execution leak | How it hurts win rate | How to detect it | Best fix |
|---|---|---|---|
| 1. Slippage | Turns acceptable entries into worse trades | Compare planned entry with actual fill | Adjust order type and avoid fast conditions |
| 2. Spread expansion | Makes entries more expensive and targets harder to reach | Log spread at signal and fill | Add spread caps and session filters |
| 3. Partial fills | Distorts average entry and exit quality | Review fill reports and average price | Reduce size or trade more liquid periods |
| 4. Late entries | Changes the trade beyond tested conditions | Track trigger time versus execution time | Use alerts, pre-plan orders, define max delay |
| 5. News spikes | Causes abnormal volatility and unreliable fills | Tag trades near major releases | Use blackout rules around scheduled events |
| 6. Overtrading | Adds low-quality trades absent from the backtest | Compare live trade count with tested frequency | Raise setup quality threshold |
| 7. Rule drift | Breaks the conditions that created the edge | Use a yes/no checklist for every trade | Lock rules and version any changes |
1. Slippage turns decent entries into poor trades
Slippage is the difference between the price you expected and the price you actually got. In fast markets, market orders and stop orders can fill worse than planned.
It hurts win rate in three ways:
- It worsens the entry price
- It effectively tightens the stop
- It makes the target harder to reach
If your stop is 6 pips and your average adverse slippage is 0.8 pips, you gave up more than 13% of the stop distance before the trade even started.
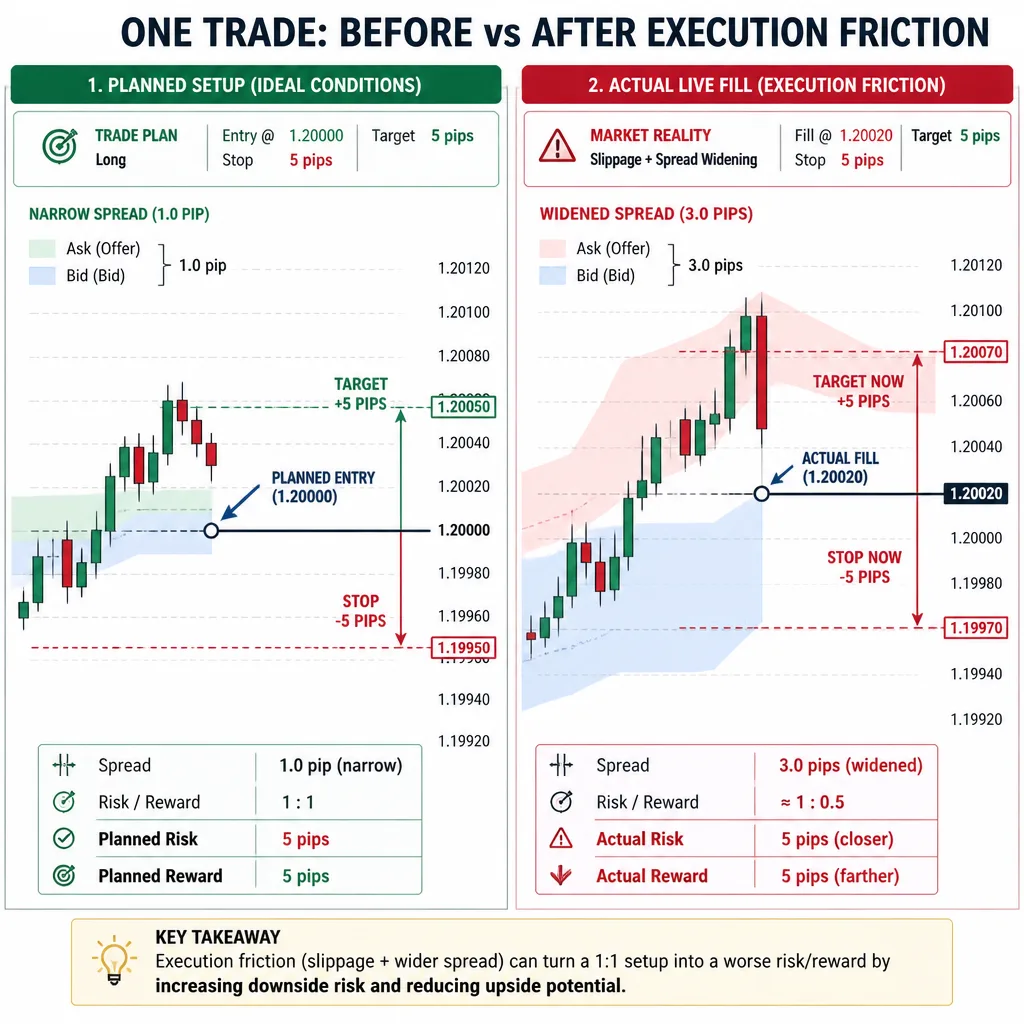
2. Spread expansion changes the real risk-reward
Spread is not constant. It often widens around rollover, thin sessions, and high-impact news.
A simple example shows why this matters. Suppose a scalp was tested with:
- 5-pip target
- 5-pip stop
- 0.8-pip spread
Now imagine the live spread at entry is 2.5 pips. You are starting from a worse effective price and need more movement just to break even. A trade that looked balanced in testing now has far less margin for error.
3. Partial fills distort position quality
This matters more in some markets than others. In spot forex, the impact depends on broker model and platform. In CFDs, futures, equities, or larger orders, it can be more obvious.
If part of the order fills at one price and the rest fills worse, your average entry no longer matches the backtest assumptions. If exits also fill unevenly, the risk-reward profile changes again.
4. Late entries change the trade itself
Late entries are common because they feel harmless.
They are not.
If your breakout triggers at one price but you enter one or two candles later, you are no longer trading the tested setup. You may be buying exhaustion instead of participating in the breakout.
For example, if an index breakout triggers at 15,850 but hesitation delays entry until 15,854, the stop and target may stay the same, but the probability profile does not.
5. News spikes create conditions your system may not be built for
Scheduled releases such as CPI, NFP, FOMC, GDP, and central bank announcements can trigger spread widening, slippage, and sudden volatility shifts.
If your backtest mostly reflects normal conditions, trades taken during these windows may not belong in the same sample at all.
A practical rule many traders use is no new entries for 15 to 30 minutes before and after tier-1 releases unless the strategy was built for event trading.
6. Overtrading lowers sample quality
This is a behavioral leak, but it still affects execution because it changes trade selection.
A backtest may show two valid trades during the London session. Live, the trader takes five because weak pullbacks, marginal breakouts, and “almost valid” setups start to feel close enough.
That lowers trade quality quickly.
7. Rule drift breaks the original edge
Rule drift happens when you slowly change the system without formally admitting it.
Maybe you skip the higher-timeframe trend filter because the chart looks “close enough.” Maybe you widen one stop, move another to breakeven too early, and take one extra trade outside your session rule.
At that point, you are no longer measuring one strategy. You are measuring a moving target.
Common Mistake: Treating every live loss as a psychology problem when the actual issue is slippage, spread expansion, or rule drift.
A practical framework to diagnose the real cause
The Live Execution Leak Audit
Use this four-step process before changing the strategy.
| Step | What to check | What it reveals | Likely next move |
|---|---|---|---|
| 1. Compare planned entry vs actual fill | Entry price, fill price, slippage, delay | Whether execution is degrading trades | Review order type and timing |
| 2. Tag by session, spread, volatility | London, New York, rollover, normal, event-driven | Whether losses cluster in certain conditions | Add session or condition filters |
| 3. Separate market vs behavior losses | Rule adherence, hesitation, forced setups | Whether friction or trader behavior is the main leak | Fix process before strategy |
| 4. Recalculate expectancy after costs | Win rate, average win, average loss, spread, slippage, commission | Whether the edge survives net of real costs | Decide if the strategy is still viable |
Step 1: Compare planned entry with actual fill
Record:
- Planned entry
- Actual fill
- Order type
- Trigger time
- Fill time
- Slippage in pips or points
- Slippage as a share of stop size
If adverse slippage repeatedly consumes 10% to 15% of your stop distance, a short-term system may be structurally weaker than it looked in testing.
Step 2: Tag trades by session, spread, and volatility
At minimum, tag each trade by:
- Session: Asian, London, New York, overlap, rollover
- Spread condition: normal, elevated, extreme
- Volatility regime: normal, elevated, event-driven
This often reveals patterns that raw P&L hides. A strategy may work during London, fail during late New York, or break down mainly around rollover.
Step 3: Separate market-driven losses from behavior-driven losses
This is where most of the clarity comes from.
Market-driven losses include valid trades degraded by slippage, spread, or event volatility.
Behavior-driven losses include late entries, skipped filters, revenge trades, and unmanaged discretion.
The distinction matters because the fixes are different.
Step 4: Check whether the edge survives real costs
Use a simple expectancy check:
Expectancy = (Win rate × Average win) - (Loss rate × Average loss)
If costs are not already included, subtract commissions, spread, and average slippage.
A lower win rate can still be acceptable if average winners remain large enough. What matters is the net edge, not hit rate alone.
Bottom Line: Diagnose first. A strategy can look weaker live even when the signal still works and only execution is failing.
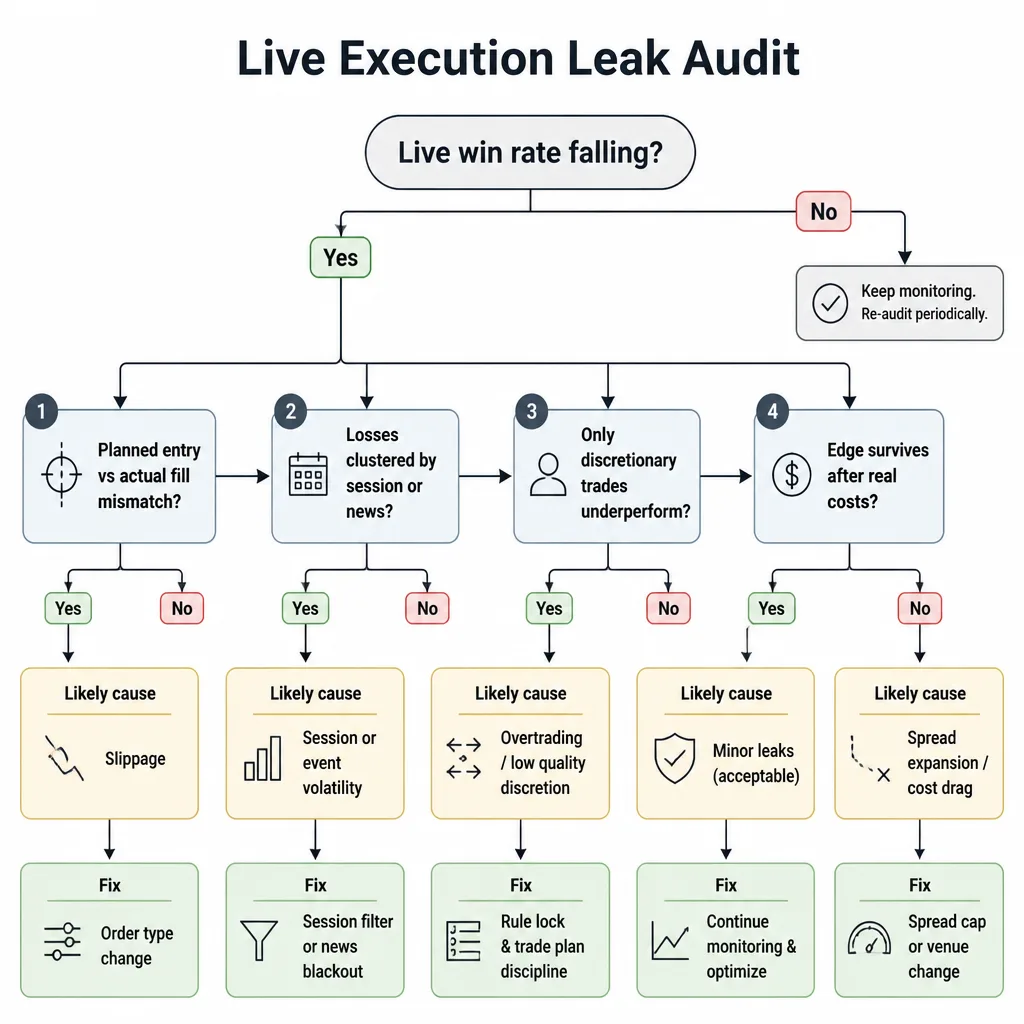
How to find the leak quickly
If fills are consistently worse than planned
Check:
- Slippage by order type
- Spread at signal and fill
- Whether you are entering during fast bursts or thin liquidity
- Whether a limit, stop-limit, or retest entry would suit the setup better
If losses cluster around specific times or events
Check:
- Session tags
- Rollover exposure
- News proximity
- Volatility regime
If the losing cluster lines up with poor-liquidity periods or scheduled events, filter those windows first.
If discretionary trades underperform
Check:
- Entry delay
- Missed or skipped filters
- Extra trades beyond the tested frequency
- Manual changes to stops or exits
This usually points to late entries, overtrading, or rule drift rather than immediate strategy failure.
If the strategy still works on chart review but not in execution
That is one of the clearest signs to audit execution before rewriting the setup.
Decision Rule: If chart review still supports the setup but live trades show worse fills or weaker discipline, fix execution before changing the strategy.
Specific fixes for each execution leak
Match order type to market condition
| Order type | Best for | Strength | Main limitation |
|---|---|---|---|
| Market order | Fast execution | Gets you in immediately | Vulnerable to slippage |
| Limit order | Precise entries | Controls price | May miss momentum trades |
| Stop order | Breakout confirmation | Enters only if price moves | Can fill poorly in spikes |
| Stop-limit order | Controlled breakout entries | Limits extreme slippage | May not fill at all |
If your strategy depends on precise entries, avoid chasing with market orders during fast moves.
Use session filters
Do not assume every session is equally tradeable.
Many forex and index systems behave better during:
- London
- New York
- London–New York overlap
They often behave worse during:
- Rollover
- Thin holiday conditions
- Quiet periods with unstable spreads
Set spread and volatility caps
Examples worth testing:
- Do not enter if spread exceeds 1.5x the median spread used in testing
- Do not enter if the trigger candle is abnormally large relative to recent average range
- Skip trades when volatility is clearly event-driven
These are not universal rules. They are testable filters.
Create news blackout rules
Use official event sources when possible, such as the Federal Reserve, ECB, BLS, and BEA calendars.
A simple rule:
- No new trades 15 minutes before to 15 minutes after tier-1 events
If your system was not designed for news, this can remove a large amount of avoidable noise.
Raise the trade quality threshold
Use a pre-trade checklist. A setup qualifies only if all key conditions are met:
- Trend alignment
- Correct location
- Acceptable spread
- Acceptable volatility
- Valid session
- Exact entry structure
This is one of the cleanest ways to reduce overtrading.
Lock rules to stop drift
Turn vague logic into yes/no rules.
Useful controls include:
- Screenshot before entry
- Mandatory checklist completion
- Fixed stop and target logic
- Defined invalidation rule
- Separate testing for any rule change before using it live
Bottom Line: Most execution leaks can be fixed operationally. They do not always require a new strategy.
Example: recovering a falling live win rate
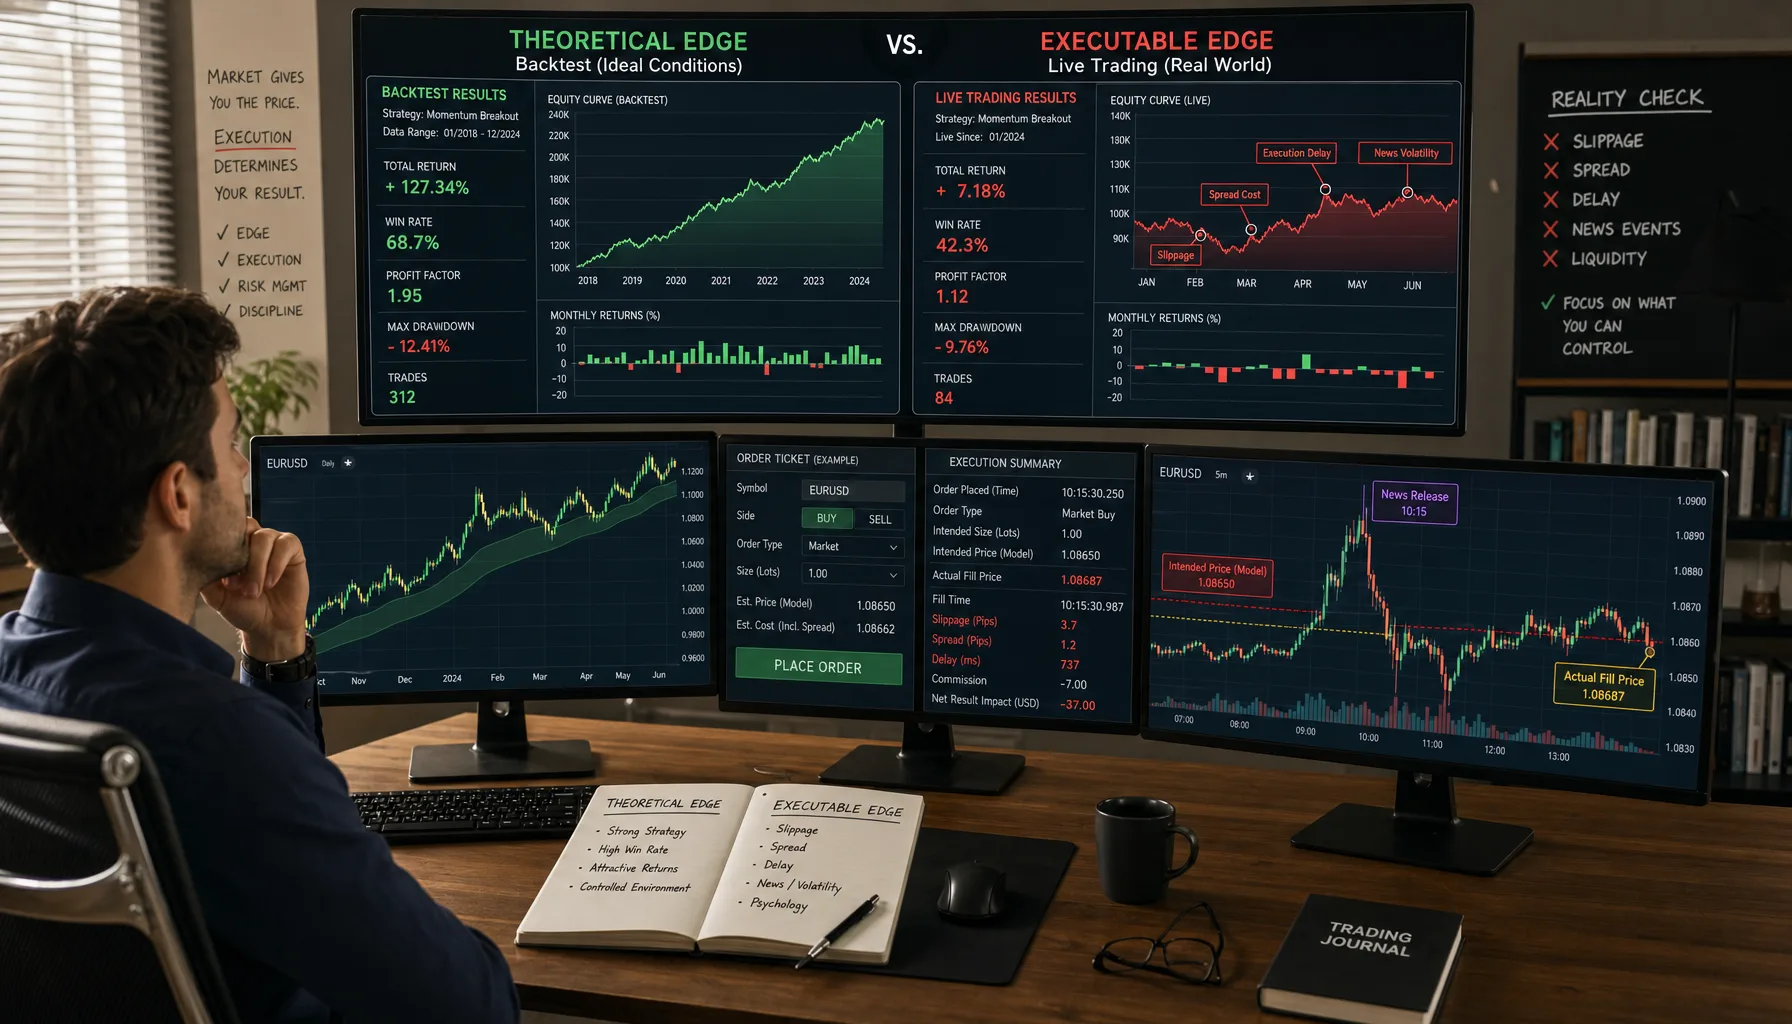
Before: solid backtest, weak live results
A trader tests a EUR/USD intraday breakout strategy over 200 trades. The backtest shows:
- 58% win rate
- 1:1.2 reward-to-risk
- Fixed 0.8-pip spread assumption
Then the first 40 live trades come in at 44% win rate.
The trader assumes the strategy failed.
What the audit found
The review reveals two main problems:
- Average entry slippage of 0.6 pips during fast London open moves
- Late entries taken one to two candles after the original breakout trigger
A second review also shows several losses near scheduled news that had not been filtered out.
So the system was not simply underperforming. It was being traded under worse conditions than it was tested.
After: targeted execution changes
The trader makes a few operational adjustments:
- Adds a spread cap
- Avoids high-impact news windows
- Replaces reactive market entries with planned retest entries or tighter order logic
- Sets a maximum entry-delay rule
That does not guarantee a return to backtest numbers. But it does produce a cleaner sample and a more honest measure of the strategy.
Common mistakes when trying to fix live underperformance
Blaming psychology for a fill-quality problem
Some losses are emotional. Some are structural. If your fills are routinely worse than planned, mindset work is not the first fix.
Changing the strategy before measuring execution friction
This destroys evidence. If you change the system and the process at the same time, you no longer know what caused the problem.
Using backtests with unrealistic assumptions
If the backtest assumes ideal spreads or instant fills, it may have overstated real-world performance from the start.
Trading every session with the same rules
Market structure changes across the day. A rule set that works in London may degrade badly during rollover or low-liquidity hours.
Common Mistake: The earlier you change the strategy, the harder it becomes to tell whether execution was the real issue.
Implementation checklist to stabilize execution
What to track on every trade
- Instrument
- Date and time
- Session
- Setup type
- Planned entry
- Actual fill
- Order type
- Spread at signal
- Spread at fill
- Slippage
- Stop size
- Target size
- Volatility regime
- News proximity
- Whether all rules were met
- Screenshot before and after
- Outcome in R
- Notes on deviations
What to review weekly
- Win rate by session
- Average slippage by order type
- Losses near major news
- Number of rule violations
- Live trade frequency versus tested frequency
- Expectancy net of live costs
Change one variable at a time
If you change order type, session filter, spread cap, and entry rules all at once, diagnosis becomes difficult.
Test one operational change at a time over a meaningful sample.
Bottom Line: Stable execution comes from measurement, not guesswork.
Conclusion
If your win rate drops in live trading, do not rush to defend the strategy or abandon it. First, identify what changed between the backtest and the market you are actually trading.
In many cases, the signal is still intact. The damage happens in execution: slippage, spread expansion, late entries, news spikes, overtrading, or rule drift. Those leaks can quietly turn marginal winners into losers or add trades that were never part of the original edge.
Protecting your edge means protecting execution. Measure planned versus actual fills, tag trades by conditions, separate market friction from behavior, and recalculate expectancy after real costs. Only then should you decide whether the strategy needs repair or whether the process does.
FAQ
Why does a strategy with a strong backtest perform worse live?
Because a backtest measures theoretical edge, while live trading tests whether that edge survives real conditions. Spreads, slippage, timing delays, news volatility, and rule drift can all reduce trade quality even when the setup logic is sound.
How can I tell whether the problem is the strategy or execution?
Compare planned entries with actual fills, then tag trades by session, spread, volatility, and rule adherence. If the setup still looks valid on chart review but fills, timing, or behavior are worse than your test assumptions, execution is the more likely problem.
How does slippage reduce win rate?
Slippage gives you a worse fill than expected. That increases effective risk, leaves less room for normal price movement, and makes it harder for trades to reach target. In short-term systems, even small slippage can matter.
Why is spread expansion so damaging?
A wider spread means you enter at a worse price and need more movement just to break even. Tight-stop and low-target systems are especially vulnerable, which is why fixed-spread backtests can overstate real performance.
What execution issues do traders most often overlook?
The most common are slippage, spread expansion, late entries, news spikes, overtrading, and rule drift. Partial fills can also matter depending on the market, broker, and order size.
Why do late entries hurt more than traders expect?
Because the edge usually exists at the original trigger price, not after hesitation or chasing. A late entry often worsens reward-to-risk and turns the setup into a different trade from the one you tested.
Can a lower live win rate still be acceptable?
Yes. A lower win rate does not automatically mean the strategy is broken. What matters is net expectancy after real costs. If average winners remain large enough and losses stay controlled, the system may still be viable.
What should I track to diagnose a falling live win rate?
Track instrument, time, session, setup type, planned entry, actual fill, order type, spread at signal, spread at fill, slippage, stop size, target size, volatility regime, news proximity, rule adherence, screenshots, and outcome in R.
How do I fix execution issues without rewriting the strategy?
Use the right order type for the condition, apply session filters, set spread and volatility caps, create news blackout rules, reduce low-quality trades, and lock rules into a checklist. Change one variable at a time so you can see what actually helps.
When should traders avoid changing the strategy?
Avoid changing it before reviewing a meaningful sample of live execution data. If you change the system too early, you lose the ability to tell whether the original edge failed or whether execution was degrading it.