Triangular Arbitrage in Forex: A Step-by-Step Workflow With Real Pair Examples and a Profitability Checklist
Textbook triangular arbitrage looks simple: compare three related currency pairs, spot a mismatch, trade the loop, collect the difference. In live markets, that story usually breaks at execution.
That gap is what matters. The challenge is not the definition. It is knowing how to calculate an implied cross rate, test whether the mismatch survives spreads and slippage, and decide whether the setup is actually tradable or just a quote illusion.
This guide covers both sides: the clean math first, then the practical filter—synchronized quotes, bid/ask treatment, execution risk, and a profitability checklist you can use.
What Problem Triangular Arbitrage Solves
Triangular arbitrage exists because three related FX quotes should be internally consistent. If they are not, a trader may be able to convert through a three-currency loop and end with more of the starting currency than they began with.
Why inconsistencies appear
In theory, the forex market should correct these gaps quickly. In practice, small mismatches can appear because of:
- fragmented liquidity
- rapid quote updates across feeds
- temporary spread changes
- stale quotes
- broker-specific pricing
- latency between snapshots[^1]
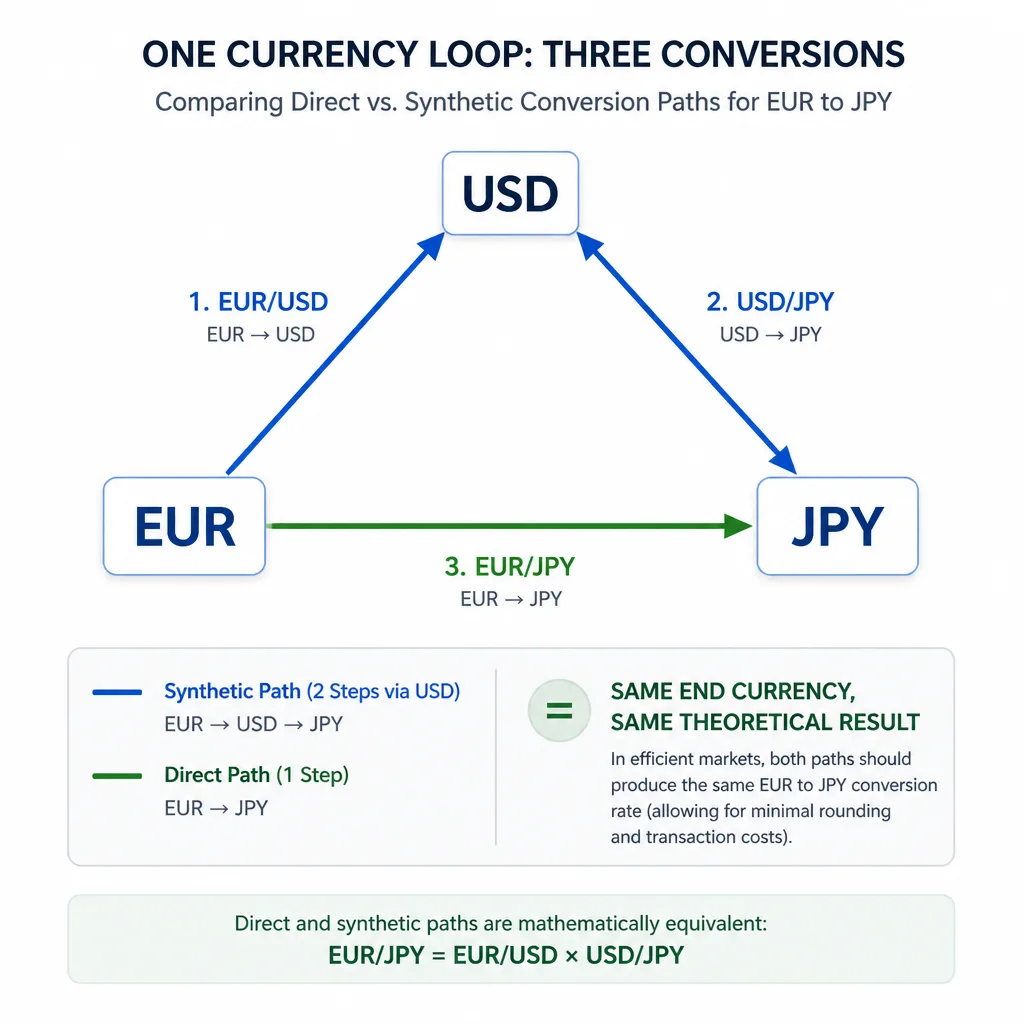
Key Insight: Triangular arbitrage is not really about “three pairs.” It is about checking whether one conversion path is cheaper or more expensive than another path to the same destination.
For example, you can get from EUR to JPY either:
- directly through EUR/JPY, or
- indirectly through EUR/USD and USD/JPY
In an efficient market, both routes should cost almost the same.
What you should be able to do after reading
By the end, you should be able to:
- calculate an implied cross rate
- adjust it for bid and ask prices
- tell when a mismatch is only theoretical
- apply a practical trading threshold
- design a more realistic tick-data backtest
Bottom Line: The concept is simple. The edge only matters if it survives real execution conditions.
How Triangular Arbitrage Works
One loop, three conversions
A triangular arbitrage loop uses three currency conversions. Suppose you start with euros:
- Convert EUR to USD
- Convert USD to JPY
- Convert JPY back to EUR
If the loop returns more EUR than you started with, there is a gross edge before costs.
Direct quote vs. implied cross rate
The direct quote is the market quote for the cross pair itself, such as EUR/JPY.
The implied cross rate is derived from two other pairs, for example:
- EUR/USD
- USD/JPY
Together they imply a value for EUR/JPY.
[ \text{EUR/USD} \times \text{USD/JPY} = \text{implied EUR/JPY} ]
The direct cross should trade close to that level.
Why a price difference is not enough
A mismatch between the direct and implied price is only the start. You still need to ask:
- Are the quotes synchronized?
- Are you using executable bid/ask prices?
- Can all three legs fill fast enough?
- Does the edge exceed costs after execution risk?
Common Mistake: Seeing a mid-price mismatch and calling it arbitrage. Most mid-price gaps disappear once you apply spreads to all three legs.
The Basic Formula for Implied Cross Rates
Clean example using mid prices
If:
- EUR/USD = 1.1000
- USD/JPY = 150.00
then:
[ \text{implied EUR/JPY} = 1.1000 \times 150.00 = 165.00 ]
So the implied cross rate is 165.00.
Why the math works
- One euro buys 1.1000 USD
- One USD buys 150.00 JPY
- So one euro buys:
[ 1.1000 \times 150.00 = 165.00 \text{ JPY} ]
That is the core cross-rate logic.
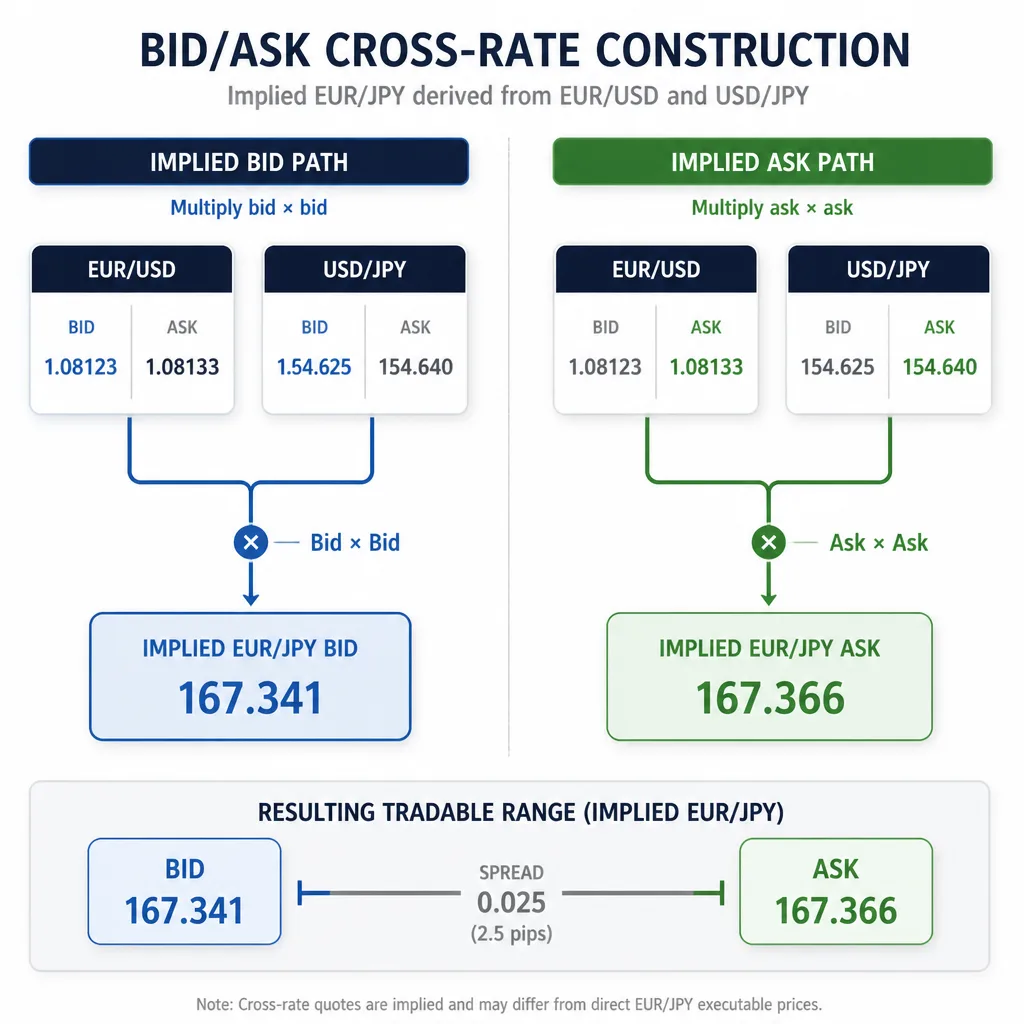
How bid and ask change the calculation
Live trading uses executable prices, not mid prices.
If quotes are:
- EUR/USD = 1.0999 / 1.1001
- USD/JPY = 149.98 / 150.02
then a practical approximation is:
- implied EUR/JPY bid = 1.0999 × 149.98 = 164.9630
- implied EUR/JPY ask = 1.1001 × 150.02 = 165.0370
Now you no longer have one number. You have a tradable range.
Decision Rule: Compare executable prices with executable prices. That means quoted cross bid vs. implied ask, and quoted cross ask vs. implied bid.
If one leg must be inverted, the math changes:
- inverted bid = 1 / original ask
- inverted ask = 1 / original bid
That is a common source of mistakes.
Real Pair Example: Testing a Potential Setup
Example 1: Mid-price logic
Suppose:
- EUR/USD = 1.1000
- USD/JPY = 150.00
- Quoted EUR/JPY = 165.20
The implied EUR/JPY is:
[ 1.1000 \times 150.00 = 165.00 ]
So the direct cross is 0.20 JPY above implied.
At first glance, EUR/JPY looks rich.
| Pair | Rate |
|---|---|
| EUR/USD | 1.1000 |
| USD/JPY | 150.00 |
| Implied EUR/JPY | 165.00 |
| Quoted EUR/JPY | 165.20 |
| Gross difference | +0.20 |
This shows the idea, but not whether it is tradable.
Example 2: Bid/ask-adjusted test
Now use executable quotes:
- EUR/USD = 1.0999 / 1.1001
- USD/JPY = 149.98 / 150.02
- EUR/JPY = 165.15 / 165.19
Implied cross:
- implied bid = 1.0999 × 149.98 = 164.9630
- implied ask = 1.1001 × 150.02 = 165.0370
Compare that to the direct cross:
| Quote Type | Implied EUR/JPY | Direct EUR/JPY |
|---|---|---|
| Bid | 164.9630 | 165.15 |
| Ask | 165.0370 | 165.19 |
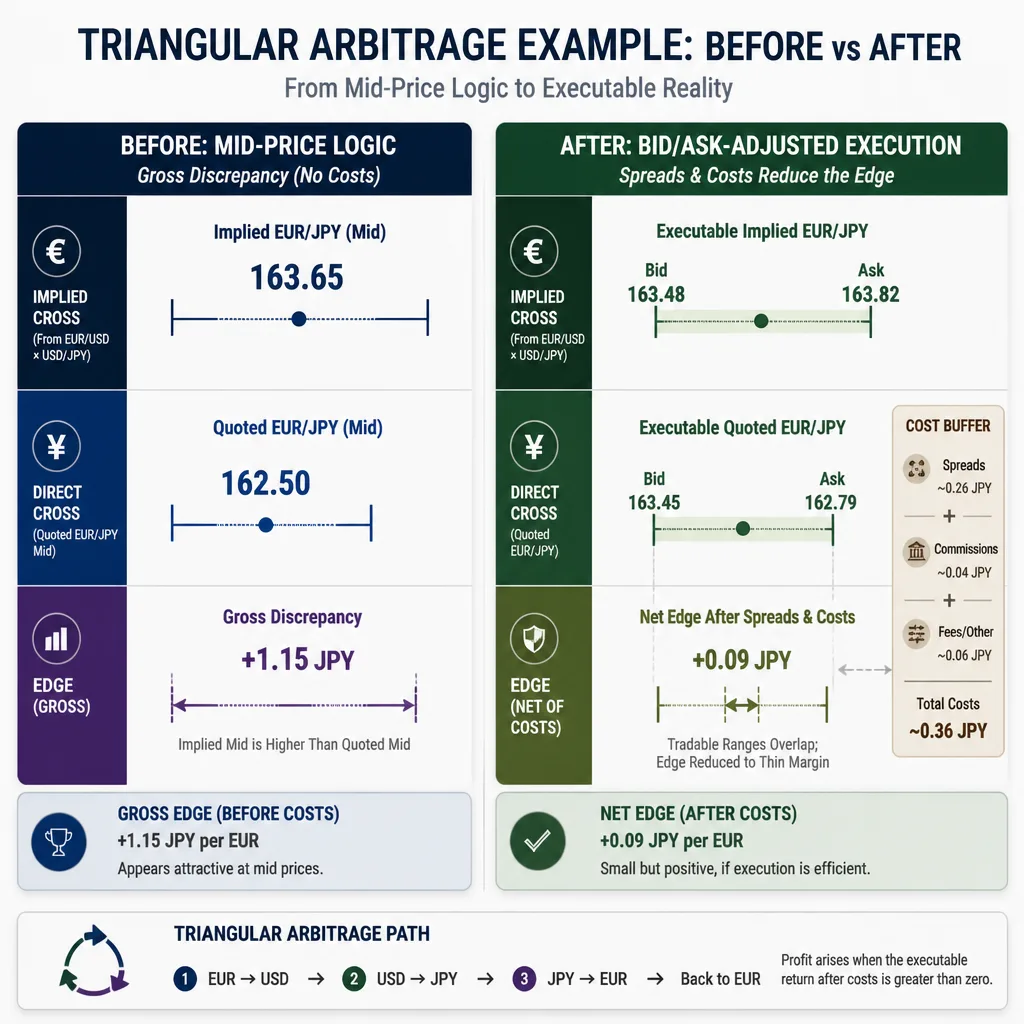
Measuring gross vs. net edge
Here the quoted EUR/JPY bid (165.15) is above the implied ask (165.0370).
That suggests a possible sell-direct, buy-synthetic setup.
Gross discrepancy:
[ 165.15 - 165.0370 = 0.1130 \text{ JPY} ]
That is the raw edge before:
- spread drift
- commissions
- latency
- partial fills
- slippage
If your all-in execution buffer is 0.09 JPY equivalent, the remaining edge is thin. If the buffer is 0.12 JPY equivalent, the opportunity is gone.
Bottom Line: Theoretical edge matters far less than the remaining edge after a realistic execution buffer.
A Practical Workflow for Detecting Opportunities
Step 1: Choose a currency triangle
Start with liquid triangles such as:
- EUR/USD + USD/JPY + EUR/JPY
- GBP/USD + USD/CHF + GBP/CHF
Liquid majors reduce false positives because spreads are tighter and fills are usually more reliable.
Step 2: Pull synchronized quotes
Use quotes that are timestamp-aligned as tightly as possible. If one pair is sampled even slightly earlier or later than the others, the mismatch may be fake.
Step 3: Calculate implied cross bid and ask
Use executable prices, not mids. Build both sides of the cross carefully, and verify whether any pair needs inversion.
Step 4: Compare implied and quoted cross rates
Check both directions:
- Buy-direct opportunity: quoted cross ask < implied cross bid
- Sell-direct opportunity: quoted cross bid > implied cross ask
Step 5: Estimate transaction costs and slippage
Include:
- all three spreads
- commissions, if any
- expected slippage
- a latency buffer
- fill-risk allowance
Step 6: Trade only if the edge clears your threshold
A useful rule is:
[ \text{Required edge} \geq \text{spread cost} + \text{commission} + \text{expected slippage} + \text{latency buffer} + \text{safety margin} ]
Decision Rule: If the discrepancy does not beat your tested cost buffer, treat it as noise.
The TRADE Check Framework
To separate textbook setups from executable ones, use this simple filter.
| Step | What it Means | Practical Question |
|---|---|---|
| T — Triangle selection | Choose liquid, stable pairs | Are all three legs actively traded with manageable spreads? |
| R — Rate consistency calculation | Compute implied bid/ask correctly | Have you verified quote direction and inversion? |
| A — All-in cost estimate | Add real execution costs | Does the edge survive spreads, commissions, and slippage? |
| D — Deployment and execution path | Define how you will enter all legs | Are you using market, limit, or synthetic execution? |
| E — Edge validation with historical data | Test with tick-level realism | Does the edge persist after latency and missed-fill modeling? |
T — Triangle selection
Favor liquid triangles. Exotics can show larger mismatches, but they often hide wider spreads and weaker fills.
R — Rate consistency calculation
This is where many traders create fake edges. One bad inversion or a wrong bid/ask assumption is enough.
A — All-in cost estimate
This is where most arbitrage ideas fail. A visible mismatch means nothing if it does not survive execution costs.
D — Deployment and execution path
Decide in advance whether you are:
- trading the direct cross plus two majors
- constructing the cross synthetically
- sending market orders
- using limits and accepting lower fill probability
E — Edge validation with historical data
If you cannot validate the edge in historical tick data, you do not yet have a strategy. You have a concept.
Execution Reality: Why Most Retail Traders Struggle
Latency and quote staleness
Many opportunities last milliseconds. Retail platforms are often too slow to capture them consistently.
A discrepancy on screen is not proof it will still exist when your order reaches the market.
Market orders, limits, and synthetic execution
Market orders improve fill probability but can increase slippage.
Limit orders improve price control but raise the chance that only part of the triangle fills.
Synthetic execution adds flexibility, but it also adds complexity because two legs must work together with precise timing.
Partial fills and leg risk
This is the main practical risk.
If two legs fill and the third does not, you are no longer running arbitrage. You are holding directional FX exposure.
Common Mistake: Assuming displayed prices guarantee a complete three-leg fill. In fast markets, that assumption is dangerous.
Broker spread widening and internalization
Retail brokers may widen spreads during:
- news events
- rollover
- low-liquidity sessions
Some also internalize order flow, which means the opportunity on one feed may not be tradable on another[^2].
Bottom Line: In triangular arbitrage, execution quality usually matters more than the math.
Profitability Checklist Before You Trade
Minimum mispricing threshold
- Have you converted the raw mismatch into a single comparable unit, such as pip-equivalent or starting-currency profit?
- Is the edge larger than total spread cost across all legs?
- Have you added commissions, if any?
- Have you added expected slippage and a latency buffer?
Required execution speed
- Do historical opportunities last longer than your end-to-end execution delay?
- Have you measured platform, VPS, and broker response time?
Fill probability and slippage assumptions
- Have you modeled full fill, partial fill, missed fill, and re-quote scenarios?
- Are your slippage assumptions based on real logs rather than best-case guesses?
Capital, margin, and position sizing
- Can your account support three-leg exposure and margin usage?
- Does the expected net edge justify the capital tied up per cycle?
When to skip a setup
- Quotes are not synchronized
- One leg is materially less liquid
- Spreads are wider than normal
- The edge is smaller than your tested threshold
- Market conditions are unstable enough to raise leg risk sharply
Decision Rule: If any core assumption is unclear, skip the trade. Arbitrage is a game of precision, not optimism.
How to Backtest a Triangular Arbitrage Edge With Tick Data
Why bar data is not enough
OHLC bar data cannot show whether all three executable quotes existed at the same moment. That makes it unreliable for triangular arbitrage.
What data you need
At minimum:
- timestamp
- bid
- ask
- pair identifier
Ideally, also collect:
- quote update sequence
- venue or broker source
- execution timestamps
- available size, if possible
How to reconstruct tradable opportunities
A realistic process looks like this:
- Align all three pairs by timestamp within a defined tolerance window.
- Compute implied bid and ask from executable quotes.
- Compare direct cross bid/ask against implied cross bid/ask.
- Flag only opportunities that exceed your threshold.
How to model latency, slippage, and missed fills
Do not test only at detection time. Shift the simulated execution forward by your realistic delay, then reprice each leg at the next available quote.
Also model:
- variable slippage by market condition
- occasional missed fills
- partial fills if your platform cannot execute all legs atomically
Metrics that matter
Track at least:
- opportunity frequency
- average gross edge
- average net edge
- fill rate
- edge decay over time
- expectancy after all modeled costs
If the edge decays faster than your infrastructure can react, it is not yours to trade.
Common Mistakes and False Positives
Using mid prices only
Mid-price analysis is useful for learning, not execution. It usually overstates opportunity.
Ignoring asynchronous quotes
This is a major source of false positives. If the three quotes were not live at the same instant, the “arbitrage” may be a data artifact.
Assuming all three legs fill instantly
Displayed quotes are not guarantees. Size may be limited, prices may update, and one leg may fail.
Confusing statistical mispricing with executable arbitrage
A model may show frequent residual mismatches in historical data. That does not mean those mismatches were tradable.
Common Mistake: Quote arbitrage is a pricing observation. Executable arbitrage is a tested trading edge.
Bottom Line: When It Is Worth Studying
For most retail traders, triangular arbitrage is more useful as an educational and diagnostic framework than as a live production strategy.
It teaches you how cross rates are built, why bid/ask treatment matters, how latency destroys edge, and why execution quality must be measured rather than assumed.
For professional firms with low-latency infrastructure, synchronized clocks, and multi-leg execution systems, it can be more than educational. But that is a very different environment from a typical retail account.
What should you test before risking money?
- your implied-rate math
- your quote synchronization
- your real execution delay
- your all-in cost threshold
- your tick-data backtest assumptions
Bottom Line: Triangular arbitrage is worth studying because it sharpens your understanding of pricing and execution. Actual profitability depends less on spotting a mismatch than on proving the mismatch survives costs, latency, and fill constraints.
FAQ
What is triangular arbitrage in Forex?
Triangular arbitrage in Forex is a three-leg currency conversion strategy that checks whether three related exchange rates are internally consistent. A trader converts one currency through two pairs and compares the implied cross rate with the directly quoted cross pair to see whether a tradable mismatch exists.
How do you calculate an implied cross rate?
A common example is deriving EUR/JPY from EUR/USD and USD/JPY. Using mid prices, the implied cross is approximately EUR/USD × USD/JPY. In live trading, you should calculate both implied bid and implied ask using executable bid/ask quotes.
Why are mid-price examples misleading?
Mid prices are useful for understanding the logic, but they ignore the spread paid on each leg. A mismatch that looks profitable at mid price often disappears once you include bid/ask quotes, commissions, slippage, and realistic execution delays.
When is an opportunity actually tradable?
A discrepancy is only actionable if the cross pair is cheap enough or expensive enough relative to the implied cross after all costs. In practice, the remaining edge must exceed spreads, commissions, expected slippage, a latency buffer, and a safety margin for fill risk.
How do bid and ask prices affect the calculation?
Each leg of the triangle executes at either the bid or the ask depending on whether you are buying or selling the base currency. That means the implied cross has a tradable bid and ask range, not a single number. If a pair must be inverted, the inverted bid becomes 1 divided by the original ask, and the inverted ask becomes 1 divided by the original bid.
Why do most retail traders struggle with triangular arbitrage?
Most retail traders face slower execution, broker spread widening, quote staleness, and higher partial-fill risk. Many opportunities last only milliseconds, so a visible discrepancy on a retail platform may not be executable by the time all three legs are placed.
What is the main execution risk?
The main practical risk is leg risk. If one or two orders fill but the final leg does not, the trader is left with directional currency exposure instead of a neutral arbitrage loop. That can turn a small theoretical edge into a real loss.
Do you need tick data to backtest triangular arbitrage?
Yes, in most cases. Tick data is usually required because bar data cannot reliably show whether executable bid/ask quotes across all three pairs were available at the same time. A proper backtest also needs latency, slippage, and missed-fill modeling.
What currency pairs are commonly used in examples?
A standard triangle is EUR/USD, USD/JPY, and EUR/JPY because it is intuitive and liquid. Another example is GBP/USD, USD/CHF, and GBP/CHF.
Is triangular arbitrage worth studying even if you do not trade it live?
Yes. Even if live execution is difficult, it is useful for understanding implied cross-rate pricing, spread mechanics, quote synchronization, and execution quality. It can also help traders judge whether a broker’s quotes and fills are competitive.