How to Choose Stocks for a Long-Term Portfolio Using Quality + Valuation Filters
Most stock-picking mistakes come from solving only half the problem. Some investors find excellent businesses and pay whatever the market asks. Others buy stocks that look statistically cheap without asking why they are cheap.
A better approach is straightforward: start with business quality, then ask whether the current price still allows for acceptable future returns. That will not guarantee outperformance, but it does help reduce two common mistakes: owning weak businesses that permanently impair capital, and overpaying for great businesses so badly that returns disappoint anyway.
If you want to build a long-term portfolio, think less about prediction and more about filtration. The goal is not to find the perfect stock. It is to reject bad candidates consistently, rank the better ones, and build a watchlist you can actually use.
Why quality should come before valuation
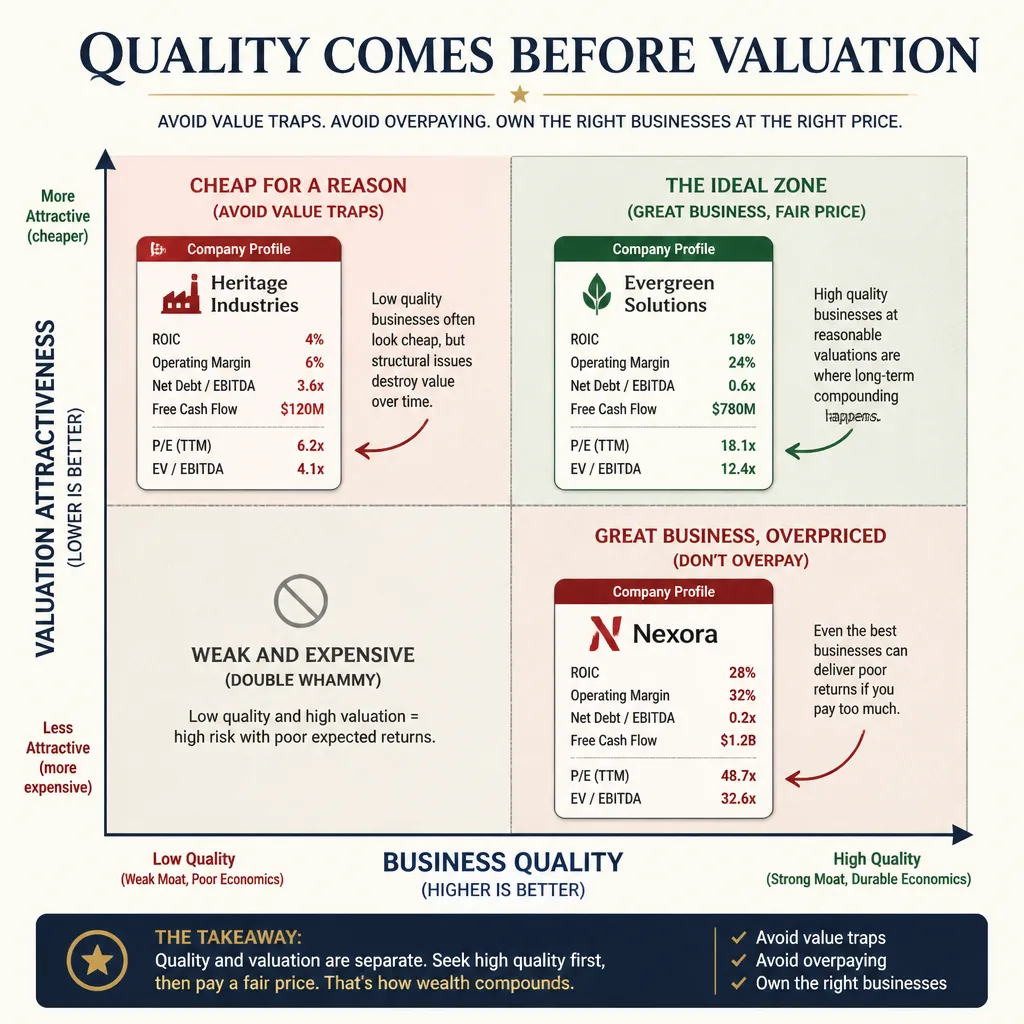
For long-term investing, quality deserves priority because bad businesses often look cheap for good reasons. A company with weak returns on capital, fragile margins, heavy debt, or poor cash conversion can destroy shareholder value even if the headline P/E looks low.
A high-quality company gives you a stronger starting point. It may have pricing power, disciplined capital allocation, repeat demand, or a balance sheet that can survive a downturn. None of that makes the stock automatically attractive, but it lowers the odds that your thesis breaks for fundamental reasons.
The real objective is not just finding low multiples. It is avoiding permanent losers.
A stock can hurt you in two very different ways:
- a weak business bought because it looks cheap
- a great business bought at a price that already assumes near-perfect execution
The framework below is built to defend against both.
Start with business quality, not the price tag
Returns on capital matter more than headline growth
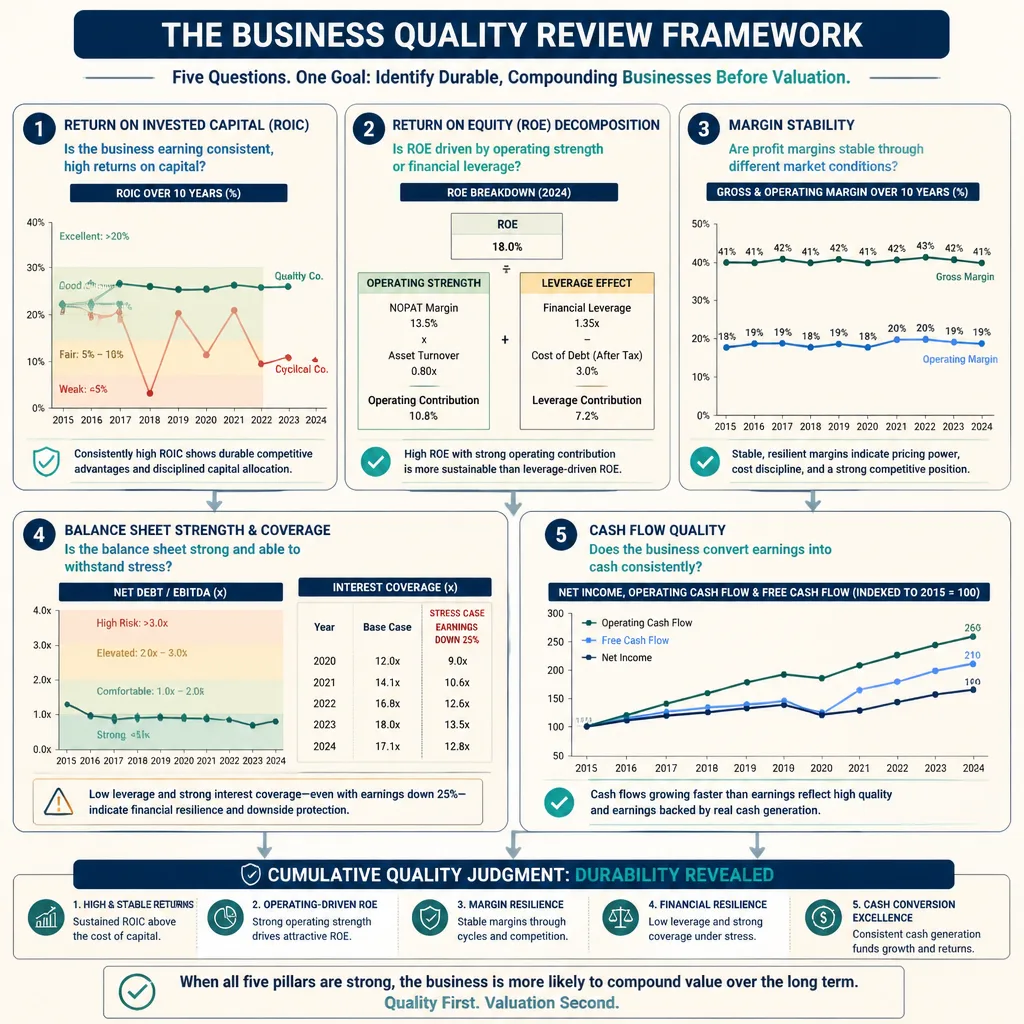
Revenue growth gets attention because it is easy to spot. ROIC is usually more revealing because it shows whether growth is actually creating value.
A company that grows 20% a year but earns poor returns on the capital it reinvests may simply be scaling a mediocre business. A slower-growing company that consistently earns high returns on invested capital is often creating more value over time.
For most non-financial businesses, sustained double-digit ROIC is often a positive sign, though industry context matters. A capital-heavy industrial business and an asset-light software business should not be judged by the same standard. What matters more than any single year is persistence across at least five years, and ideally ten.
A consumer staples firm posting 14% to 18% ROIC through strong and weak demand periods tells you something very different from a cyclical manufacturer that hits 18% only at the top of the cycle.
ROE needs context
ROE can be useful, but only if you understand what drives it. High debt, aggressive buybacks, or a shrinking equity base can make ROE look impressive even when the underlying business is average.
A DuPont-style mindset helps here. Ask whether ROE is high because the company has strong margins and efficient operations, or because it is highly leveraged.
If two companies both report 20% ROE, but one has modest debt and strong free cash flow while the other is stretched, they are not equally attractive.
Margin stability often signals durability
Margins tell you more than whether a business is profitable. They can also tell you how durable the business may be.
Stable gross margins can suggest pricing power or customer stickiness. Stable operating margins can indicate cost discipline and lower vulnerability to shocks. Declining margins over several years usually deserve more attention than they get.
This is where filings matter. Screeners show numbers; annual reports explain them. If margins are falling, is the company investing for growth, facing stronger competition, losing bargaining power, or operating in a structurally worse market? The answer changes the thesis.
Primary sources like company annual reports and SEC filings on EDGAR are worth checking whenever the story and the numbers do not line up.[^1]
Balance sheet strength matters most in bad years
Weak balance sheets turn ordinary problems into permanent ones.
For non-financial companies, useful checks include net debt to EBITDA, interest coverage, debt maturities, and how the company performed in a bad year. Interest coverage comfortably above roughly 3x to 5x is often healthier than marginal coverage, but that range is directional, not universal. Utilities, telecoms, and REIT-like businesses often carry more debt than asset-light firms.
The key question is not whether a company uses debt. Most do. The real question is what happens if earnings fall 20% to 30%.
If the answer is equity dilution, covenant stress, or refinancing risk, the cheap valuation may not be cheap enough.
Cash flow helps test earnings quality
A business that regularly reports earnings but struggles to turn them into cash deserves skepticism.
Compare net income with operating cash flow and free cash flow over several years. If reported profits rise while cash generation lags, you may be looking at aggressive accruals, working-capital strain, or a business that is far more capital-intensive than it first appears.
That is one reason many experienced investors put more weight on free cash flow than adjusted earnings presentations. Not always, but often.
Then ask whether the stock is reasonably priced
Valuation is about future returns
Valuation is not just a style label. It is the link between business quality and your future return.
A great company can still be a poor investment if today’s price already assumes years of high growth, stable margins, and flawless execution. That is usually what investors mean when they say a stock is priced for perfection.
The market often gives high-quality businesses premium multiples for good reason. The mistake is assuming any premium is justified.
Useful valuation anchors
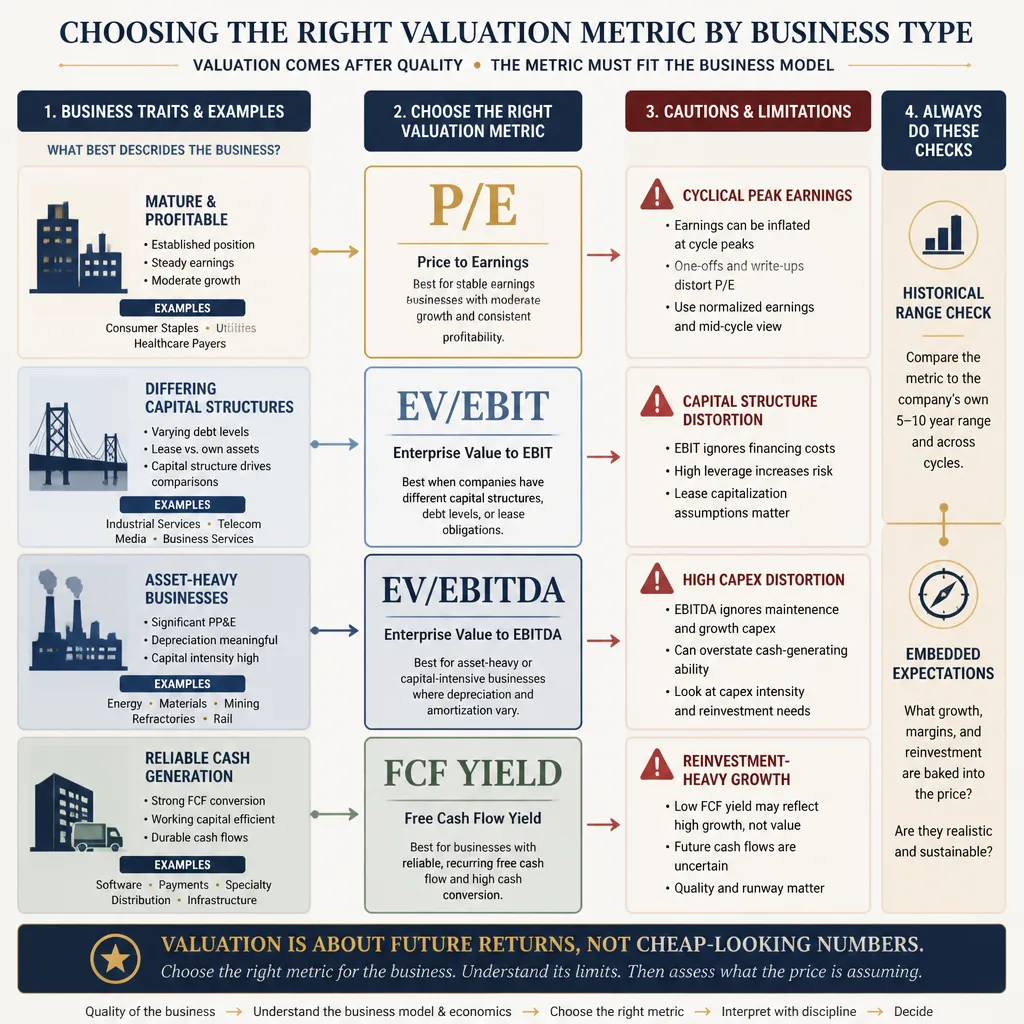
No single multiple works across every sector.
- P/E works reasonably well for mature, consistently profitable businesses.
- EV/EBIT is often better when capital structures differ.
- EV/EBITDA can help in asset-heavy comparisons, though it can flatter businesses with high ongoing capital expenditure.
- Free cash flow yield is useful when cash generation is reliable.
Historical valuation ranges can also help, if used carefully. If a stock usually trades at 18x to 22x earnings and now trades at 32x, the burden of proof is higher. That does not automatically make it overpriced. It means you need a better reason than “it’s a great company.”
Match the metric to the business
This is where many retail investors go wrong. A cyclical stock at peak margins can look cheap on trailing P/E just before earnings normalize lower. A fast-growing company can look expensive on free cash flow yield if it is sensibly reinvesting in high-return opportunities.
Use the metric that best fits the economics of the business, not the one that gives the lowest-looking number.
Use modest assumptions
You do not need a full discounted cash flow model to stay disciplined. You do need to ask what expectations the current price seems to require.
A simple test helps: if revenue growth slows, margins stay merely normal, and the market eventually assigns a more ordinary multiple, would the investment still work?
If the answer is no, the stock may depend too much on a perfect outcome.
A simple quality + valuation scoring sheet
How the scoring framework works
A scoring sheet should improve consistency, not replace judgment. Its best use is ranking candidates and forcing you to compare like with like.
A practical structure is:
- 60 points for quality
- 30 points for valuation
- 10 points for red flags and qualitative judgment
That weighting reflects a simple idea: quality lowers the odds of owning a broken business, while valuation determines how much return may be left for you.
Sample scoring categories
| Category | Points | What you're looking for |
|---|---|---|
| ROIC/ROE consistency | 15 | Strong multi-year returns, not one-year spikes |
| Margin stability | 10 | Gross and operating margins holding up over time |
| Balance sheet strength | 15 | Manageable debt, solid interest coverage, survivable downturns |
| Free cash flow conversion | 10 | Earnings supported by cash generation |
| Resilience in weaker years | 10 | Business remains profitable or stable during stress |
| Valuation vs history and peers | 15 | Reasonable relative to its own range and comparable firms |
| Embedded expectations | 15 | Price does not require heroic growth assumptions |
| Red flags / qualitative judgment | 10 | Governance, dilution, customer concentration, accounting issues |
What the score should mean
A score above 75 might deserve deeper research. A score below 60 might be an easy pass. But the score is not the decision.
A company can score well and still be a poor investment if disruption risk is rising or management incentives are poor. A company can score modestly and still be interesting if it is improving and your edge comes from understanding what is changing.
Use the score as a filter, not autopilot.
Example: how to use the sheet in practice
Step 1: Review 5 to 10 years of business quality
Suppose you are reviewing a global consumer brand. Over the last decade, ROIC stayed between 12% and 17%, gross margins were steady, operating margins dipped only briefly during inflation pressure, and free cash flow was positive in nearly every year. Debt is present but manageable, and interest coverage remains comfortable.
That does not prove the stock is a buy. It does suggest the business is worth your time.
Step 2: Check whether valuation already assumes too much
Now imagine the stock trades near the top of its historical P/E range and at a premium to peers, while revenue growth is expected to slow from high single digits to low single digits.
That changes the decision. You may still like the company, but the expected return from today’s price may be mediocre unless margins expand further or growth reaccelerates. Great business, maybe poor entry point.
Now flip the example. A stock trades at 9x earnings, but margins have been falling for six years, debt is rising, and cash flow repeatedly trails accounting profit. That is the classic “cheap for a reason” setup.
Step 3: Write a one-paragraph investment case
Before buying, force yourself to write one paragraph covering:
- what the business does
- why it may be durable
- what could break the thesis
- why the current valuation is reasonable or not
- what evidence would prove you wrong
This is where many weak ideas collapse. If you cannot explain the business simply, or if your valuation case depends on several optimistic assumptions at once, that is useful information.
Common traps this process helps you avoid
The classic value trap
Low multiples are often an invitation to investigate, not a conclusion. Many value traps share a few features: falling margins, high leverage, cyclical peak earnings, weak free cash flow, or structural decline in the core business.
Story stocks with weak cash flow
Some companies deserve years of reinvestment before free cash flow appears. Others simply never prove the economics.
The difference usually shows up in unit economics, customer retention, gross margin structure, and evidence that scale improves profitability. If cash flow is always a future promise and never a present reality, confidence should stay low.
High ROE created by debt
A leveraged company can look efficient right until the cycle turns. High ROE without balance-sheet context is not enough.
Great companies bought at return-killing prices
This may be the most painful mistake because the business often keeps performing well. The error is not admiring the company. It is paying so much that future returns have little room left.
Where this framework works less well
Banks and insurers need different metrics
For financial firms, debt works differently. Better measures often include return on equity, return on tangible common equity, capital ratios, credit quality, reserve adequacy, net interest margin, or underwriting discipline.
Commodity and cyclical businesses can distort averages
Trailing margins and earnings can be deeply misleading in cyclical sectors. Mid-cycle earnings power and balance-sheet survival matter more than last year’s multiple.
Turnarounds rarely pass clean quality screens
A genuine turnaround may have ugly historical numbers and still become a good investment. But that is a different process. It usually requires more judgment, lower confidence, and tighter position sizing.
How to build a watchlist you can actually use
Rank first, then research deeper
Start with a broad screen, apply your checklist, and narrow the field. For most retail investors, a focused watchlist of 10 to 25 names is far more useful than 100 names they never study properly.
Recheck quality less often than price
Quality changes slowly. Price changes every day.
That means you can refresh your full business review quarterly, after annual reports, or after major events. Valuation is worth monitoring more often because an excellent business only becomes a good stock when the entry price makes sense.
Use the sheet as a decision aid
The scoring sheet helps you stay disciplined. It does not remove uncertainty. Always verify key figures in filings, especially if screener data conflicts with company reports.[^2]
Conclusion
If you want a repeatable way to choose stocks for a long-term portfolio, start with business quality and then judge valuation. That order matters. Quality helps reduce the risk of owning permanent losers. Valuation protects your return from overpaying, even for excellent companies.
The best use of this framework is not to produce a magical score. It is to improve judgment. Review five to ten years of returns on capital, margins, debt, and cash flow. Then ask whether today’s price already assumes too much. Rank candidates, write a short investment case, and wait for the right setup.
A good stock usually begins as a good business, but it only becomes a good investment at a reasonable price.
FAQ
Why should business quality come before valuation?
Because low-quality businesses can destroy capital even when they look cheap. Starting with quality reduces the risk of owning companies with weak economics, fragile balance sheets, or poor cash-flow support. Valuation still matters, but it matters more after you confirm the business is durable.
What financial metrics matter most for long-term stock selection?
For most non-financial companies, the best starting points are ROIC, ROE with context, gross and operating margin stability, debt levels, interest coverage, operating cash flow, and free cash flow. No single metric is enough on its own. The goal is to see whether business quality holds up across several years.
What is a good ROIC or ROE for a long-term investment?
There is no universal cutoff. Sustained double-digit ROIC is often attractive, but industry context matters. A capital-heavy business may look strong at a lower level than an asset-light one. With ROE, be careful: leverage or large buybacks can make the number look better than the underlying business really is.
How many years of financial history should I review before buying a stock?
Five years is a practical minimum, and ten years is better when available. A longer history helps you avoid judging quality based on one unusually strong period and shows whether margins, returns on capital, and cash generation hold up across different conditions.
Which valuation metric is best: P/E, EV/EBIT, EV/EBITDA, or free cash flow yield?
It depends on the business. P/E is often fine for mature, consistently profitable companies. EV/EBIT or EV/EBITDA can be more useful when debt levels differ across companies. Free cash flow yield is helpful when cash generation is reliable, though it can understate value if a company is reinvesting heavily for sensible reasons. Match the metric to the business model.
How can I tell if a stock is cheap or just a value trap?
A stock may be cheap for a reason if profits are cyclical, margins are deteriorating, debt is high, or cash flow does not support reported earnings. A low multiple should begin the investigation, not end it. If business quality is weakening or the balance sheet looks fragile, the low valuation may be justified.
What should a simple stock scoring sheet include?
A practical scoring sheet can use 100 points: 60 for quality, 30 for valuation, and 10 for red flags or qualitative judgment. Typical categories include ROIC or ROE consistency, margin stability, balance-sheet strength, free cash flow conversion, resilience in weaker years, valuation versus history and peers, and major governance or dilution concerns.
Can a scoring sheet replace deeper stock research?
No. A scoring sheet improves consistency and helps rank ideas, but it cannot replace business understanding. It will not fully capture competitive threats, management incentives, industry disruption, or accounting nuance. It works best as a decision aid before deeper research in filings, annual reports, and earnings materials.
Where does this framework work less well?
It is less clean for banks, insurers, commodity producers, highly cyclical businesses, and turnarounds. Those companies often need different metrics or a mid-cycle earnings approach. For financial firms, investors usually focus more on capital ratios, credit quality, underwriting discipline, and returns on equity or tangible equity.
How many stocks should make it onto a watchlist?
For many retail investors, a focused watchlist of roughly 10 to 25 names is more useful than a large list that never gets reviewed properly. The exact number depends on how much time you have, but the main goal is to follow a manageable set of businesses closely enough to act when valuation becomes attractive.